In this lab, I will be locating and manipulating Linux log files.
- Part 1: Log File Overview
- Part 2: Locating Log Files in Unknown Systems
- Part 3: Monitoring Log Files in Real Time
Requirement for the successful complition of this lab
Virtual Machine with Linux distribution (In this Lab, I am utilizing Arch Linux distribution)
Part 1: Log File Overview
Log files (also spelled logfiles), are files used by computers to log events. Software programs, background processes, services, or transactions between services, including the operating system itself, may generate such events. Log files are dependent on the application that generates them. It is up to the application developer to conform to log file convention. Software documentation should include information on its log files.
Step 1: Web server log file example
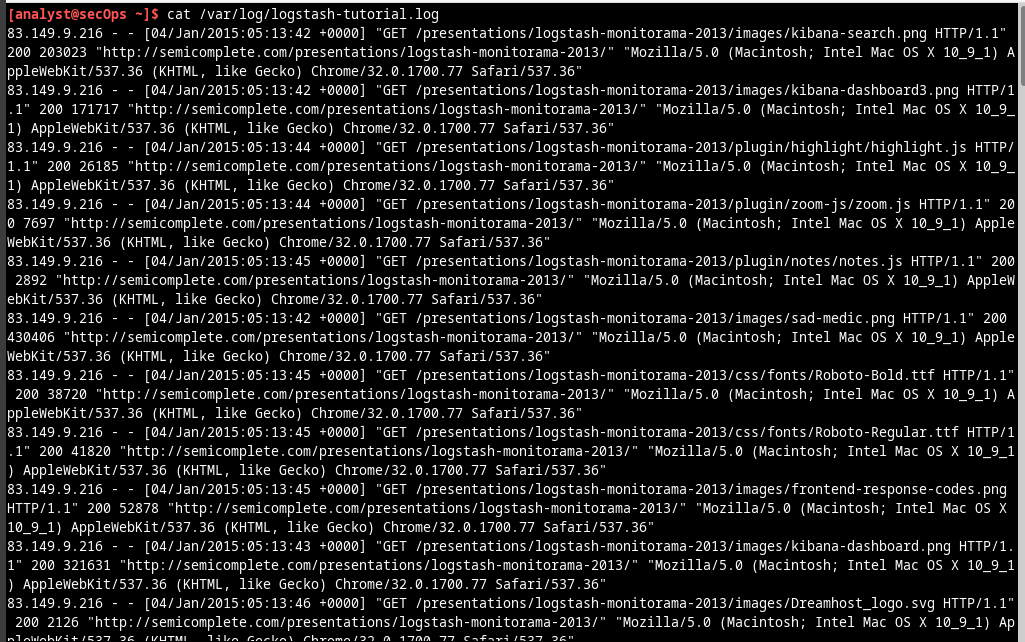
Because log files are essentially a way to track specific events, the type of information stored varies depending of the application or services generating the events. In web transactions, A few pieces of information are important, including client IP address, time and details of the transaction. It can be broken down into five main parts:
- Timestamp: This part records when the event took place. It is very important that the server clock is correctly synchronized as it allows for accurately cross-referencing and tracing back events.
- Type: This is the type of event. In this case, it was an error.
- PID: This contains information about the process ID used by Apache at the moment.
- Client: This records the IP address of the requesting client.
- Description: This contains a description of the event.
I will be using the cat command below to list a web server sample log file. The sample file is located at /var/log:
Step 2: Operating system log file example
Any software can keep log files, including the operating system itself. Conventionally, Linux uses the /var/log directory to stores various log files, including operating system logs. Modern operating systems are complex pieces of software and therefore use several different files to log events. This section takes a quick look at the /var/log/messages file.
Stored under /var/log, the messages file stores various system events. The connection of new USB drive,
a network card becoming available, and too many missed root login attempts, are a few examples of
events logged to the /var/log/messages file. Use the more command to display the contents of the
/var/log/messages file. Unlike the cat command, more allows for a paced navigation through the file.
Press ENTER to advance line-by-line or SPACE to advance an entire page. Press q or CTRL + C to
abort and exit more.
Note: the sudo command is required because the messages file belongs to the root user.
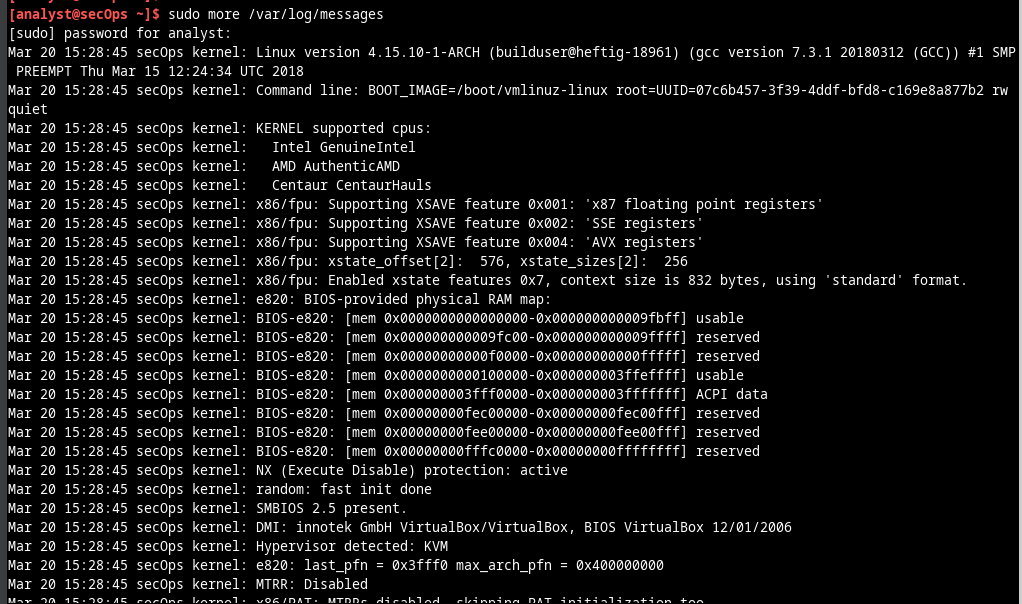
The events listed above are very different from the web server events. Because the operating system itself is generating this log, all recorded events are in relation to the OS itself. Log files are very important for troubleshooting.
Part 2: Locating Log Files in Unknown Systems
Workstation VM includes nginx, a lightweight web server. This section I will find and display nginx logs using the Workstation VM. Note: nginx was installed on the Workstation VM with its default settings. With default settings, its global configuration file is located under /etc/nginx/nginx.conf, its access log file is at /var/log/nginx/access.log, and errors are redirected to the terminal window. However, it is common for a security analyst to work on computers in which the installation details for tool and services are unknown. This section describes the process of locating such files described for nginx but is by no means complete. Nevertheless, it should be a good exercise about locating and displaying log files on unfamiliar systems.
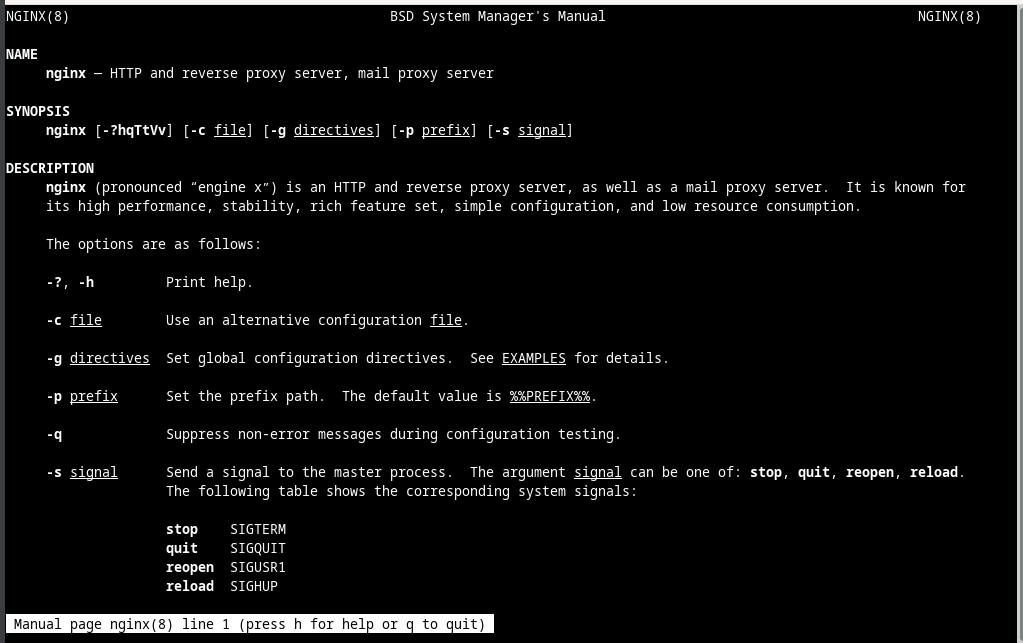
When working with new software, the first step is to look at the documentation. It provides important information about the software, including information about its log files. I Use the man command to display the nginx manual page: man nginx
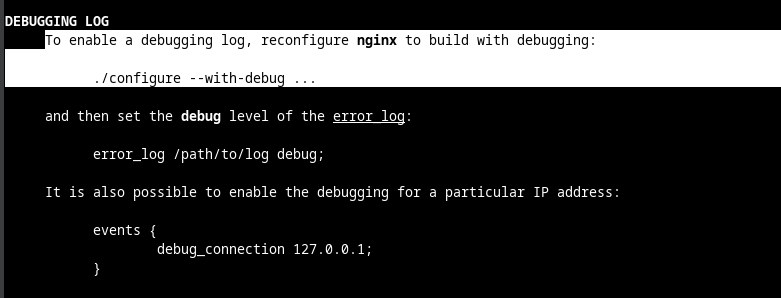
I scrolled down the page to locate the nginx logging section. The documentation makes it clear that nginx supports logging, with the location of its log files defined at compilation time.
The manual page also contains information on the files used by nginx. Scroll down further to display the nginx operating files under the Files section:
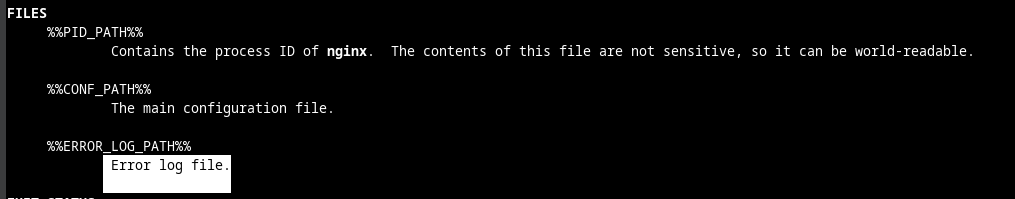
The outputs above help me to conclude that nginx supports logging and that it can save to log files. The output also hints at the existence of a configuration file for nginx.
Before looking for nginx files, I used the ps and the grep commands to ensure nginx is running in the VM. Note: I Used man to learn more about ps and grep commands which the screenshot is not in this documentation.
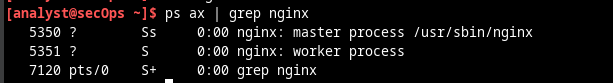
The output above confirms that nginx is running. In addition, the output also displays the parameters used when nginx was started. nginx process ID is being stored in /run/nginx.pid and error messages are being redirected to the terminal. Note: If nginx is not running, enter the sudo /usr/sbin/nginx at the prompt to start the service using the default configuration.
Note: If you need to restart nginx, you can kill the service by using the sudo pkill nginx command. To start nginx with the custom configuration from a previous lab, run the following command: sudo nginx -c custom_server.conf, and test the server by opening a web browser and going to URL: 127.0.0.1:8080. If you wish to start nginx with a default configuration you can start it with the command: sudo /usr/sbin/nginx, and open a web browser and go to URL: 127.0.0.1. Because the location to the log files was not specified, the global nginx configuration file should be checked for the location of the log files
By design, the Workstation VM utilizes default locations and definitions as much as possible. Conventionally, the /var/log directory holds various log files for various applications and services while configuration files are stored under the /etc directory. While the nginx manual page did not provide an exact location for its log files, it not only confirmed that nginx supports logging but also hinted at the location of a configuration file. Because the log file locations can often be customized in configuration files, a logical next step is to use the ls command to look under /etc and look for a nginx configuration file:
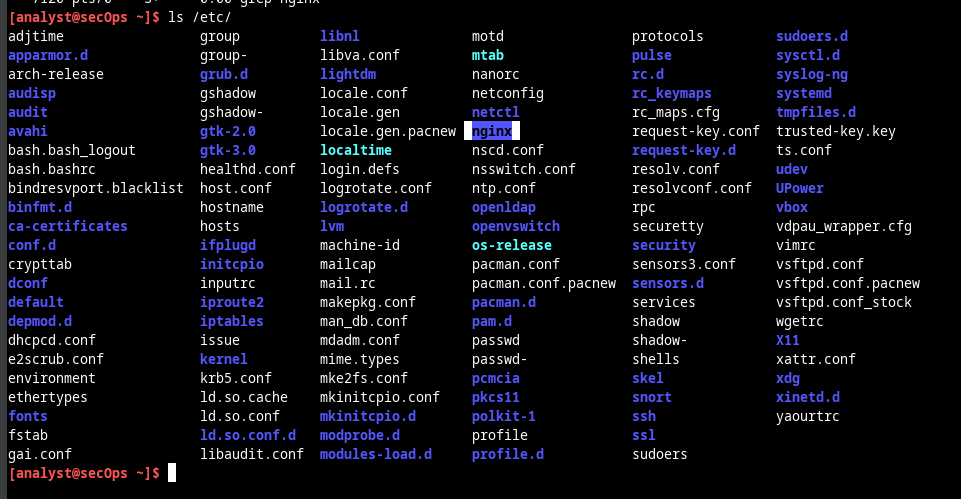
Notice the nginx folder under /etc in the output above. Using ls again, we find a number of files, including one named nginx.conf.
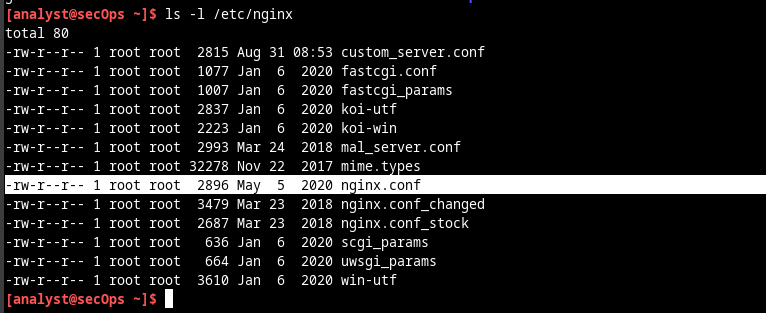
I Used the cat command to list the contents of /etc/nginx/nginx.conf. You can also use more or less to view the file and nano or SciTE to edit it. These tools make it easier to navigate through long text files (only the output of cat is displayed below).
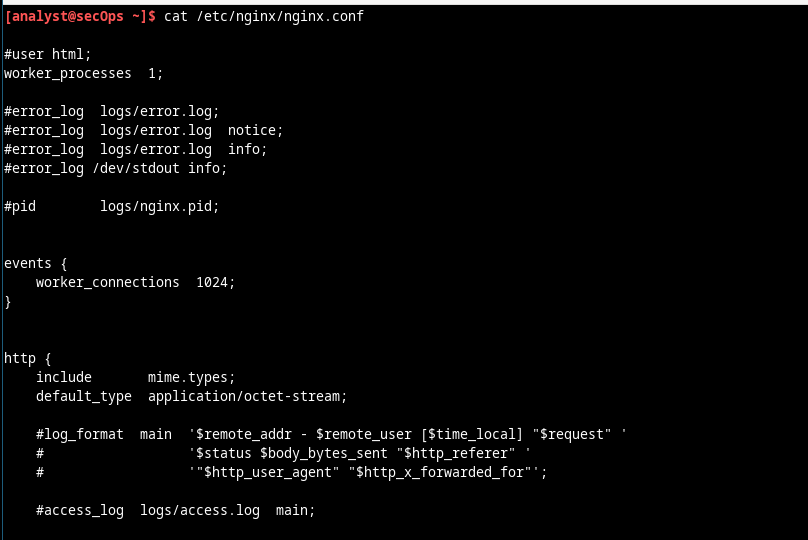
Lines that start with ‘#’ are comments and are ignored by nginx.
A quick look at the configuration file reveals that it is an nginx configuration file. Because there is no direct mention to the location of nginx log files, it is very likely that nginx is using default values for it. Following the convention of storing log files under /var/log, use the ls command to list its contents: ls -l/var/log/
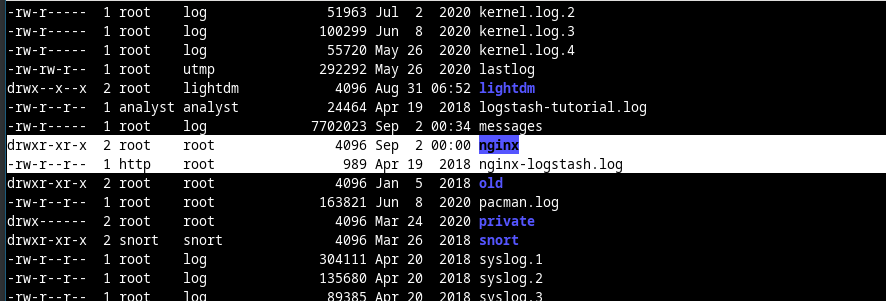
As shown above, the /var/log directory has a subdirectory named nginx. I used the ls command again to list the contents of /var/log/nginx. Note: Because the /var/log/nginx belongs to the http user, you must execute ls as root by preceding it with the sudo command.
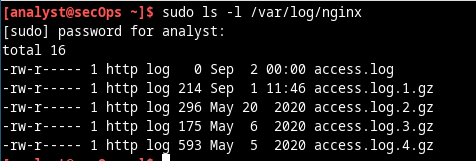
These are very likely to be the log files in use by nginx. Move on to the next section to monitor these files and get confirmation that they are indeed nginx log files.
Note: Your output may be different. The .GZ log files above were generated by a log rotation service. Linux systems often implement a service to rotate logs, ensuring that individual log files do not become too large. The log rotate service takes the latest log file, compresses it and saves it under a different name (access.log.1.gz, access.log.2.gz, etc). A new empty main log file is then created and used to store the latest log entries.
Part 3: Monitoring Log Files in Real Time
As seen in the previous sections, log files can be displayed with many text-presentation tools. While cat, more, less, and nano can be used to work with log files, they are not suitable for log file real-time monitoring. Developers designed various tools that allow for log file real-time monitoring. Some tools are text-based while others have a graphical interface. This lab focuses on tail, a simple but efficient tool, available in practically every Unix-based system. The Workstation VM I'm using uses a log rotating system to ensure that older logs are archived. By the time this lab gets used in class, some time will have passed and the log files will likely have been rotated. The result is that some log files, including the access.log file, could appear empty. To work around this problem and create some entries in access.log, simply open Firefox in the VM, point it to 127.0.0.1 and reload the page a few times.
Step 1: Using the tail command
The tail command displays the end of a text file. By default, tail will display the last ten (10) lines of a text file. Note: If you do not see any log entries, navigate to 127.0.0.1 in a web browser and refresh the page a few time.
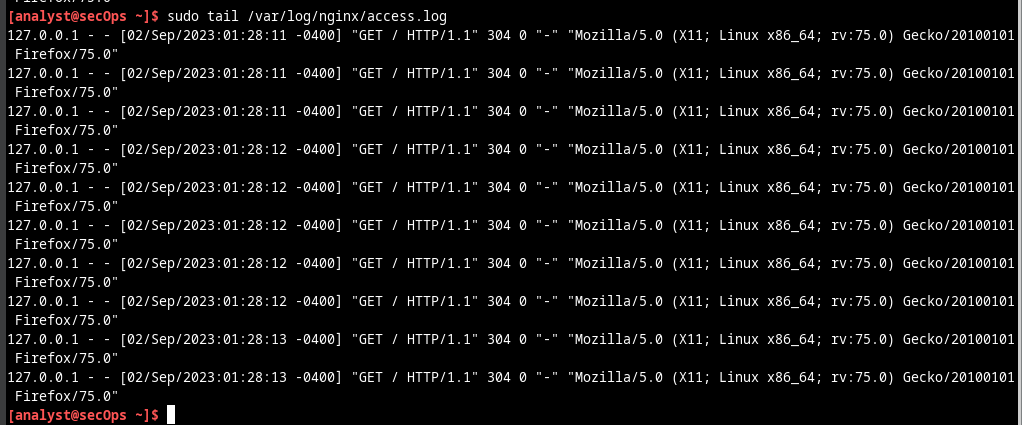
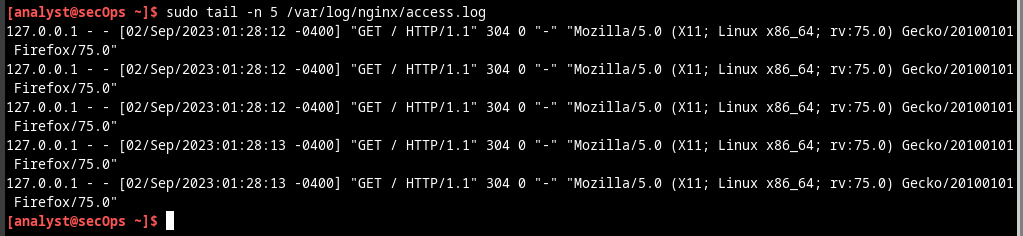
Use the tail command to display the end of the /var/log/nginx/access.log.
Note: If you do not see any log entries, navigate to 127.0.0.1 in a web browser and refresh the page a few time. Use the –n option to specify how many lines from the end of a file, tail should display.
You can use the tail command with the -f option to monitor the nginx access.log in real-time. Short for follow, -f tells tail to continuously display the end of a given text file. In a terminal window, issue tail with the –f option:
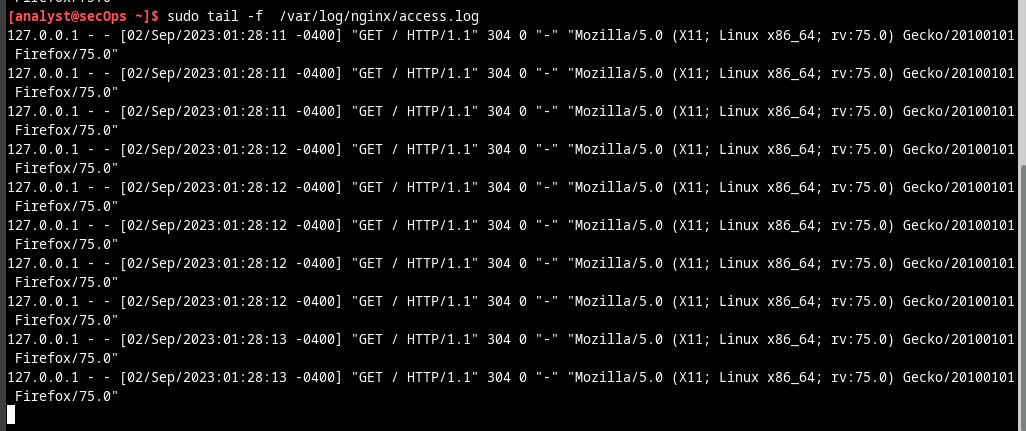
As before, tail displays the last 10 lines of the file. However, notice that tail does not exit after displaying the lines; the command prompt is not visible, indicating that tail is still running. Note: Your /var/log/access.log file may be empty due to log rotation. Continue following the lab as an empty /var/log/access.log file will not impact the lab. With tail still running on the terminal window, click the web browser icon on the Dock to open a web browser window. Re-size the web browser window in a way that it allows you to see the bottom of the terminal window where tail is still running. Note: In the screenshot below, the Enter key was pressed a few times in the terminal window running tail. This is for visualization only as tail does not process any input while running with –f. The extra empty lines make it easier to detect new entries, as they are displayed at the bottom of the terminal window.
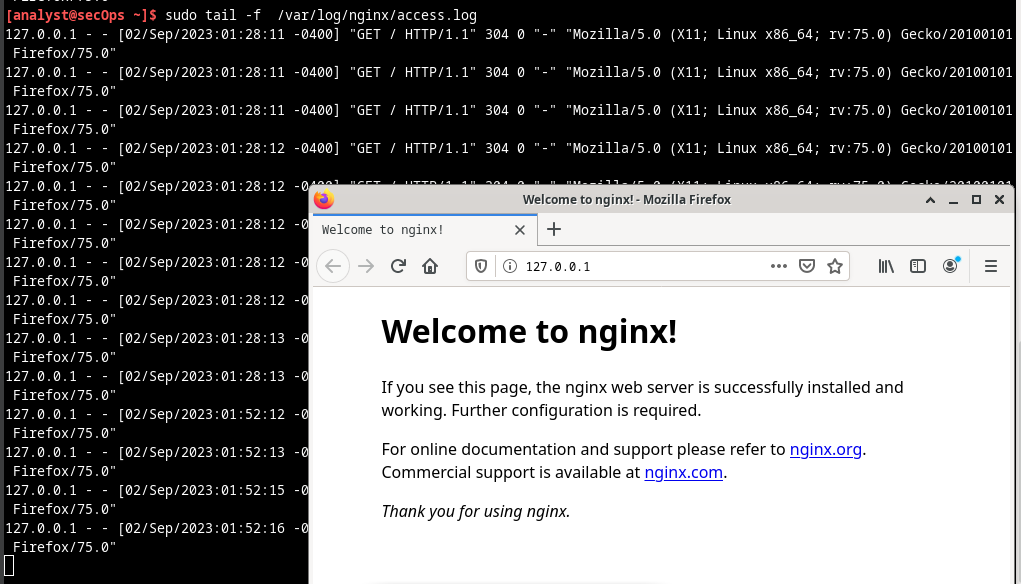
In the web browser address bar, enter 127.0.0.1 and press Enter. This is the address of the VM itself, which tells the browser to connect to a web server running on the local computer. A new entry should be recorded in the /var/log/nginx/access.log file. Refresh the webpage to see new entries added to the log. 127.0.0.1 - - [23/Mar/2017:09:48:36 -0400] "GET / HTTP/1.1" 200 612 "-" "Mozilla/5.0 (X11; Linux i686; rv:50.0) Gecko/20100101 Firefox/50.0" Because tail is still running, it should display the new entry at the bottom of the terminal window. Aside from the timestamp, your entry should look like the one above.
Note: Firefox stores pages in cache for future use. If a page is already in cache, force Firefox to ignore the cache and place web requests, reload the page by pressing '<'CTRL+SHIFT+R'>'.